


01 August 2025
Donald Trump has repeatedly imposed, or threatened to impose, a tariff, or tax, on imports since he began his second term of office in January 2025. The book “The Economic Consequences of Mr Trump” argues that the President’s policy approach is a terrible mistake. The trade deficit is not a crisis for the US; tariffs fall mostly on domestic producers and consumers, rather than on foreign countries; tariffs will not bring back lost manufacturing jobs; and the struggles facing many people who voted for Mr Trump are nothing to do with trade.
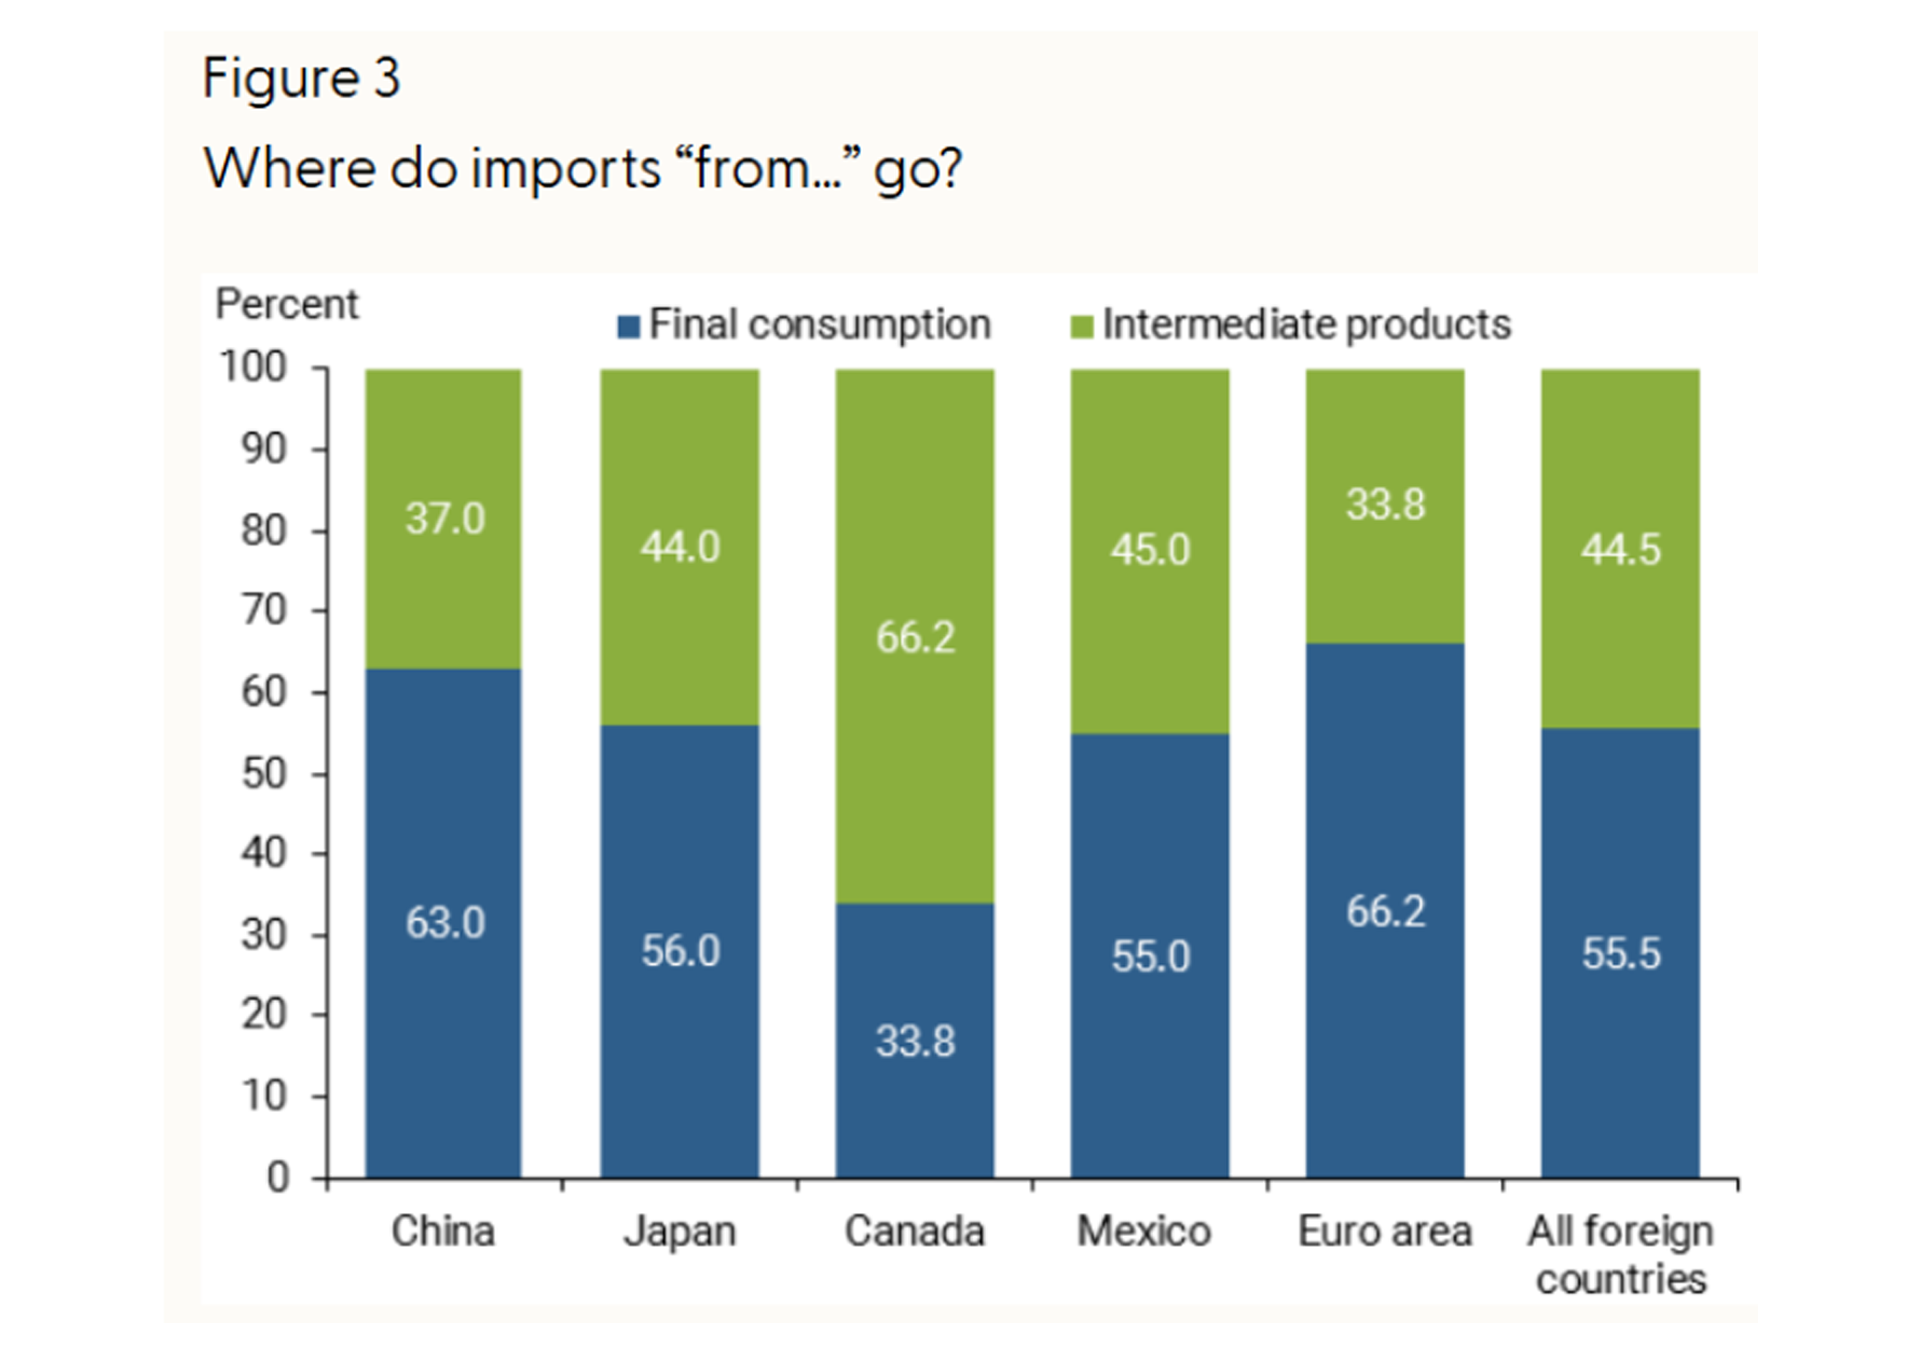
These graphs show some of the evidence. Let us start with the impact of tariffs. Around 45% of the goods that the US imports are components or raw materials that US producers need to make finished goods. A tariff is thus a tax on US producers. (The graph comes from the San Francisco Federal Reserve.)
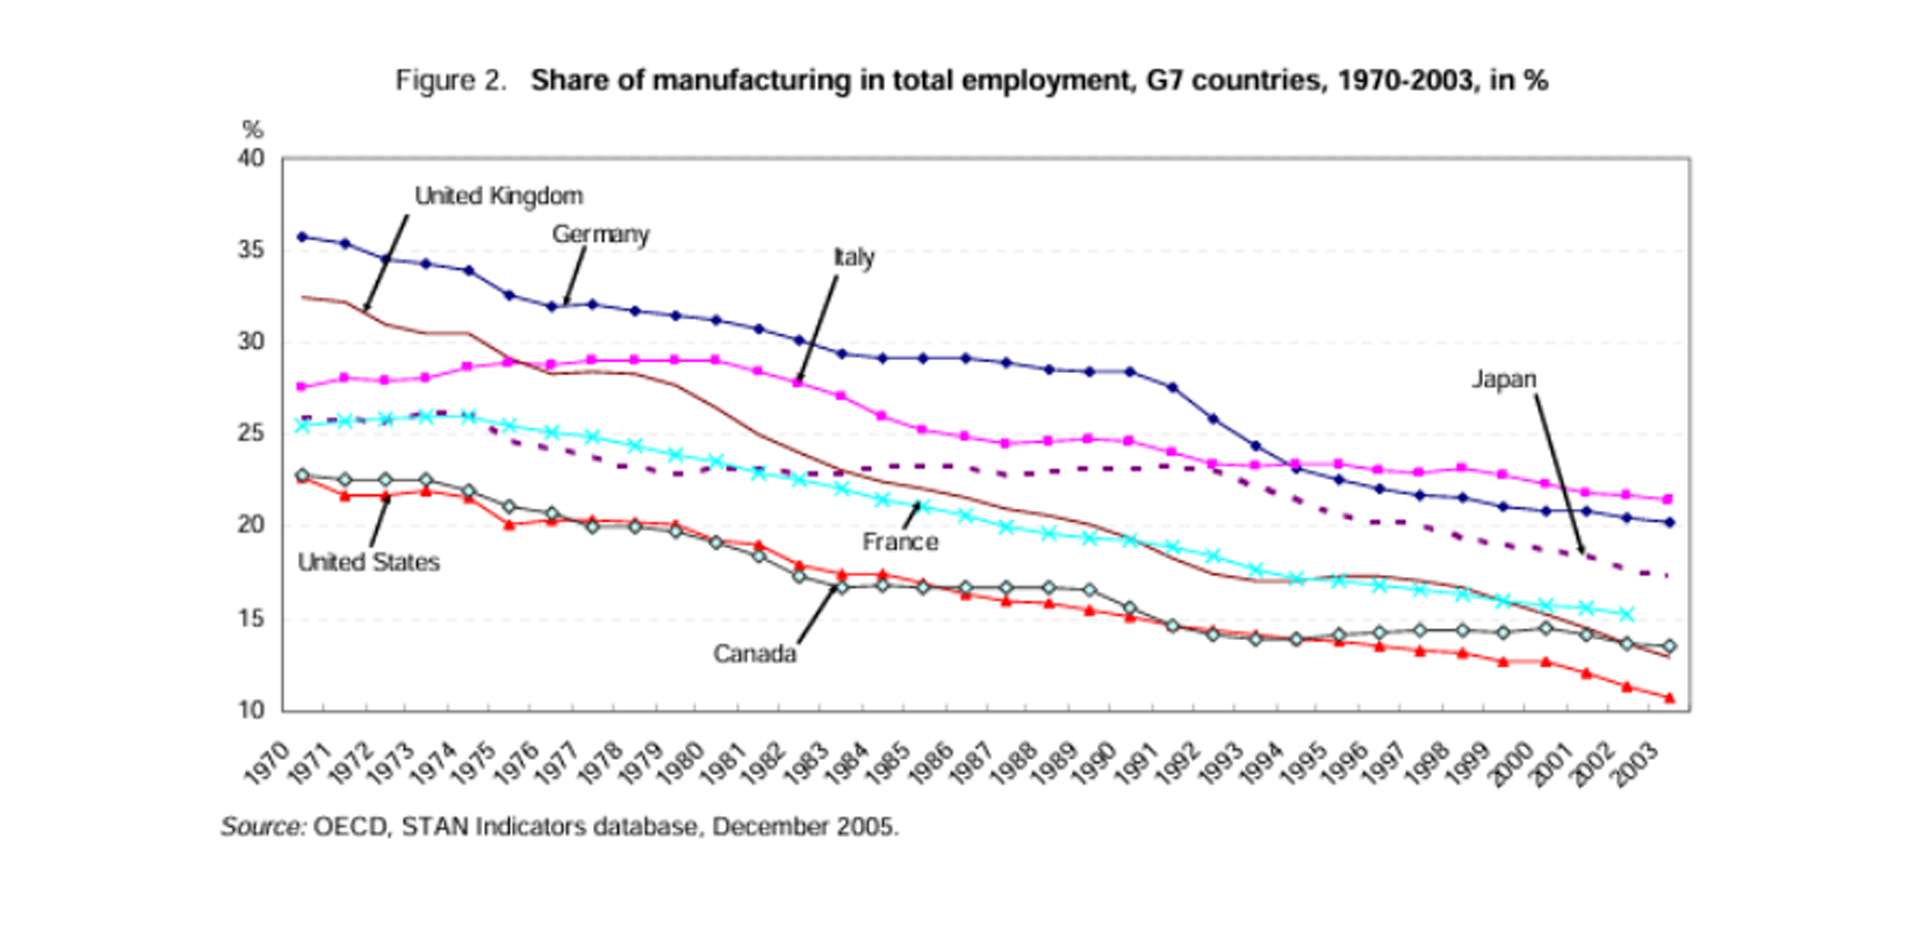
President Trump has argued that tariffs will bring manufacturing jobs back to the US. But manufacturing employment in the western world has been declining for decades. This graph from the OECD shows the decline in the proportion of manufacturing jobs in the last three decades of the 20th century. Jobs were declining in countries with trade surpluses (like Germany and Japan) as well as in the US. And all this happened well before China joined the World Trade Organisation in 2001. Technology, not trade, was the main factor.
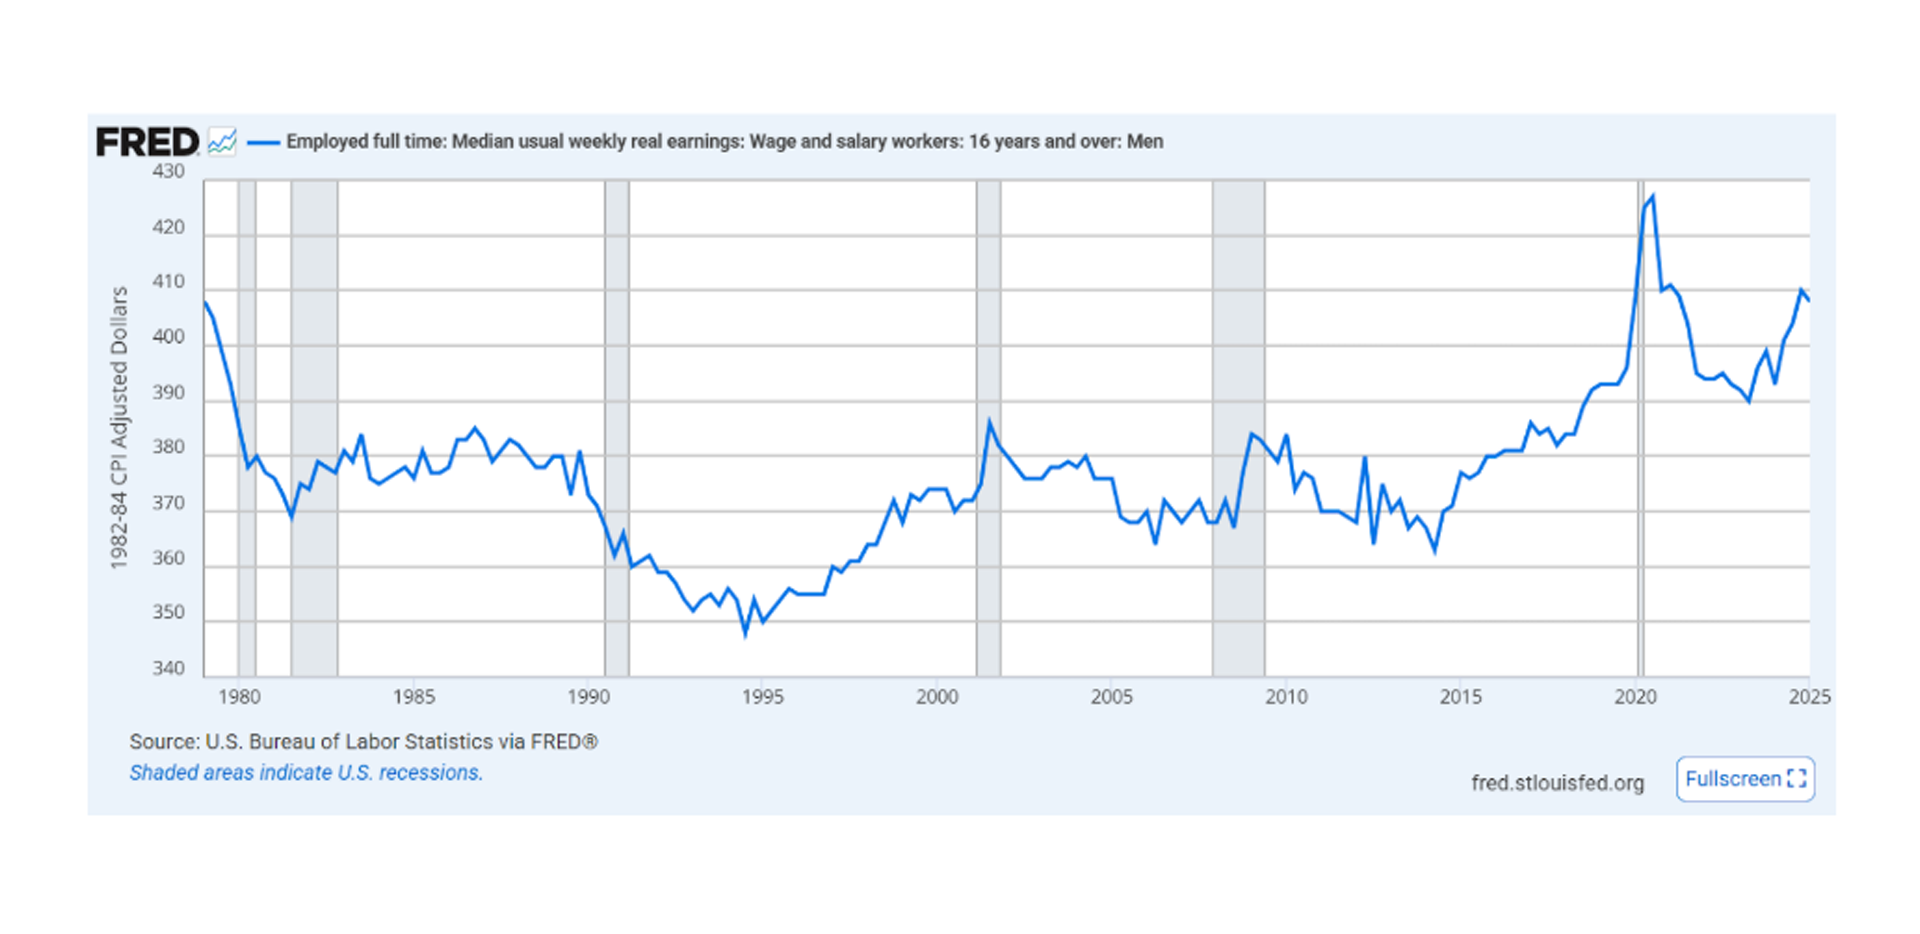
Nor is the stagnation in US real wages the result of China joining the World Trade Organisation or the US taking part in a free trade agreement with Canada and Mexico, which took effect in 1995. This graph, from the Federal Reserve Bank of St Louis, shows the big decline occurred before 1995. They then perked up after 2015.
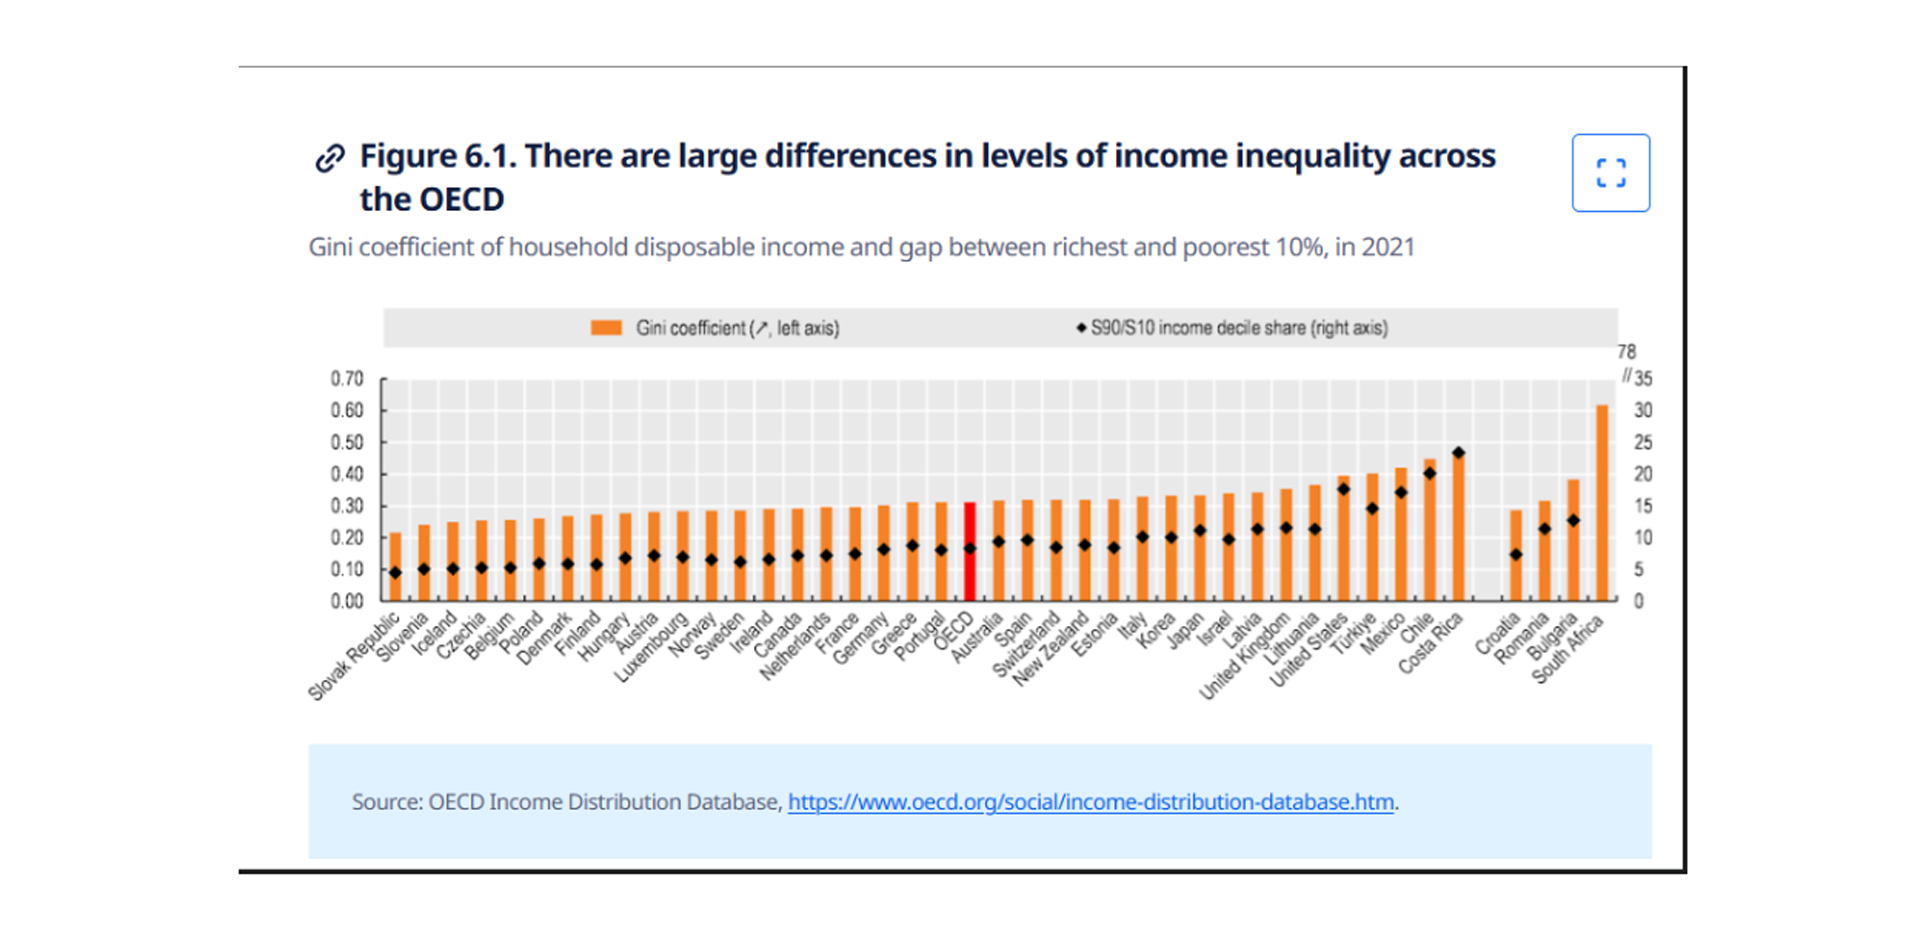
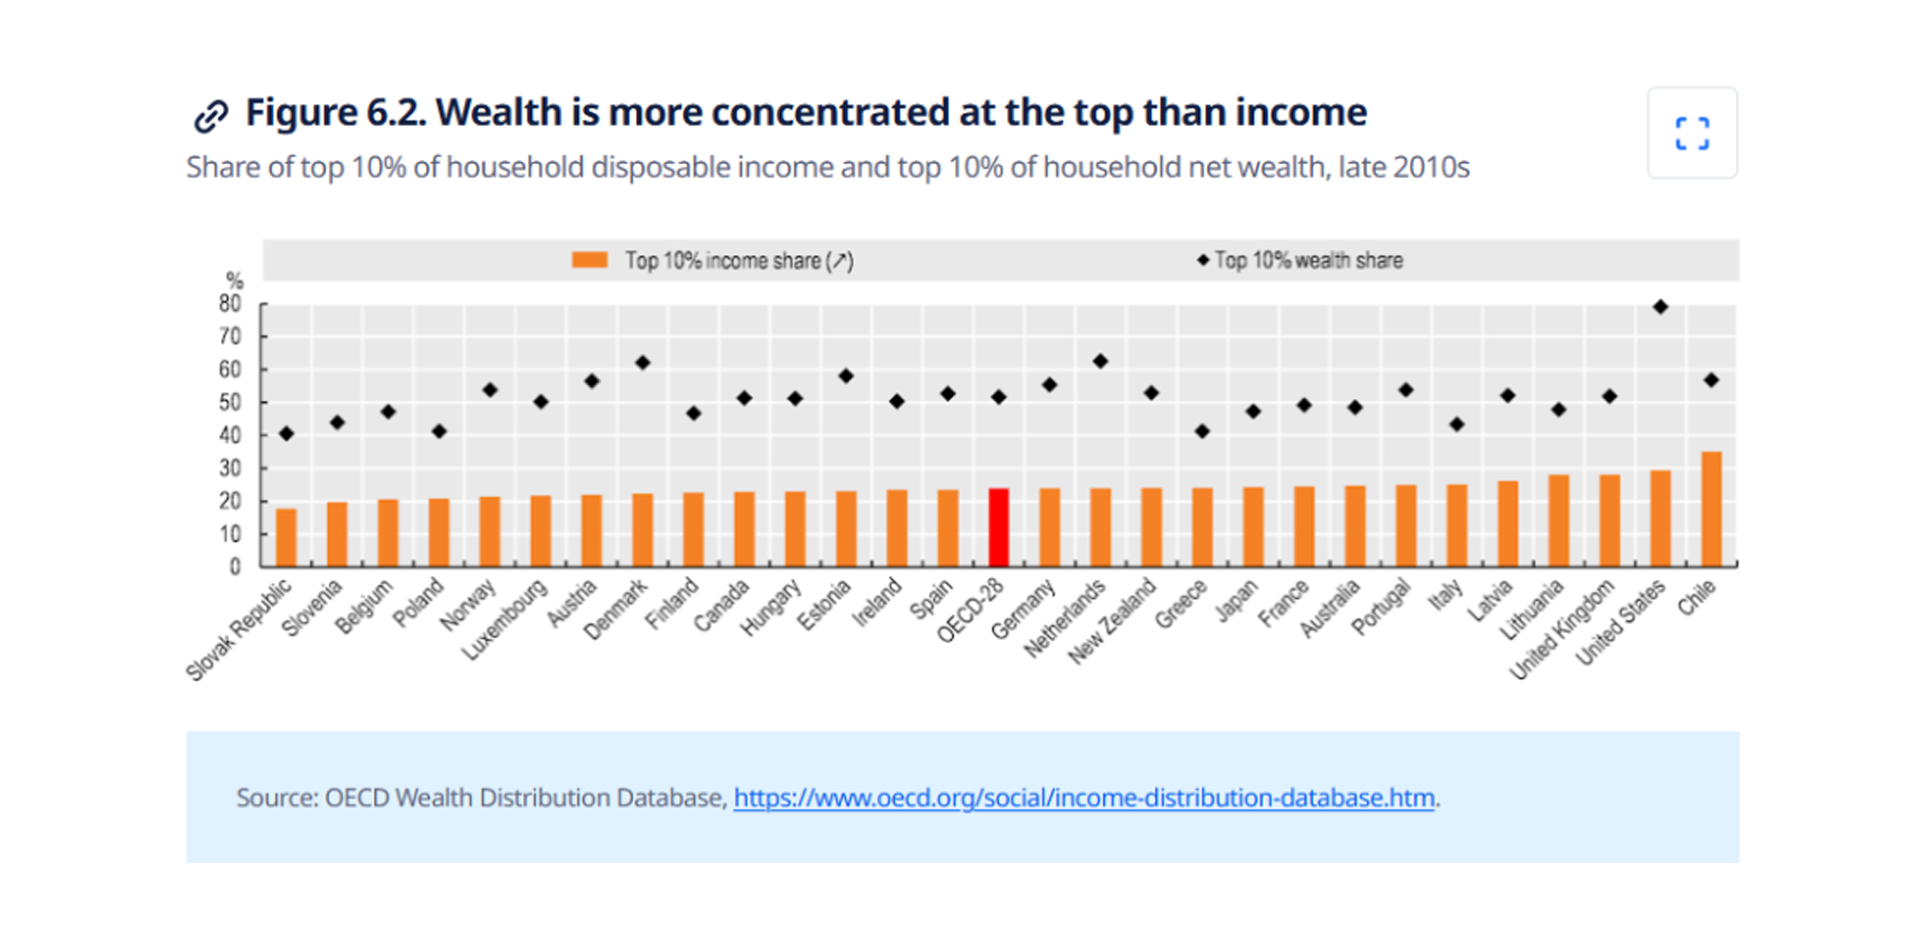
All countries face the challenge of globalisation and trade competition with China. But the US is a lot less equal than other countries. The bars in the first chart show the extent of income inequality; the black diamonds in the second chart show the inequality in wealth. The top 10% of Americans own almost 80% of the wealth. That is the result of domestic US policies, not the fault of China or Mexico. The graph is from the OECD.
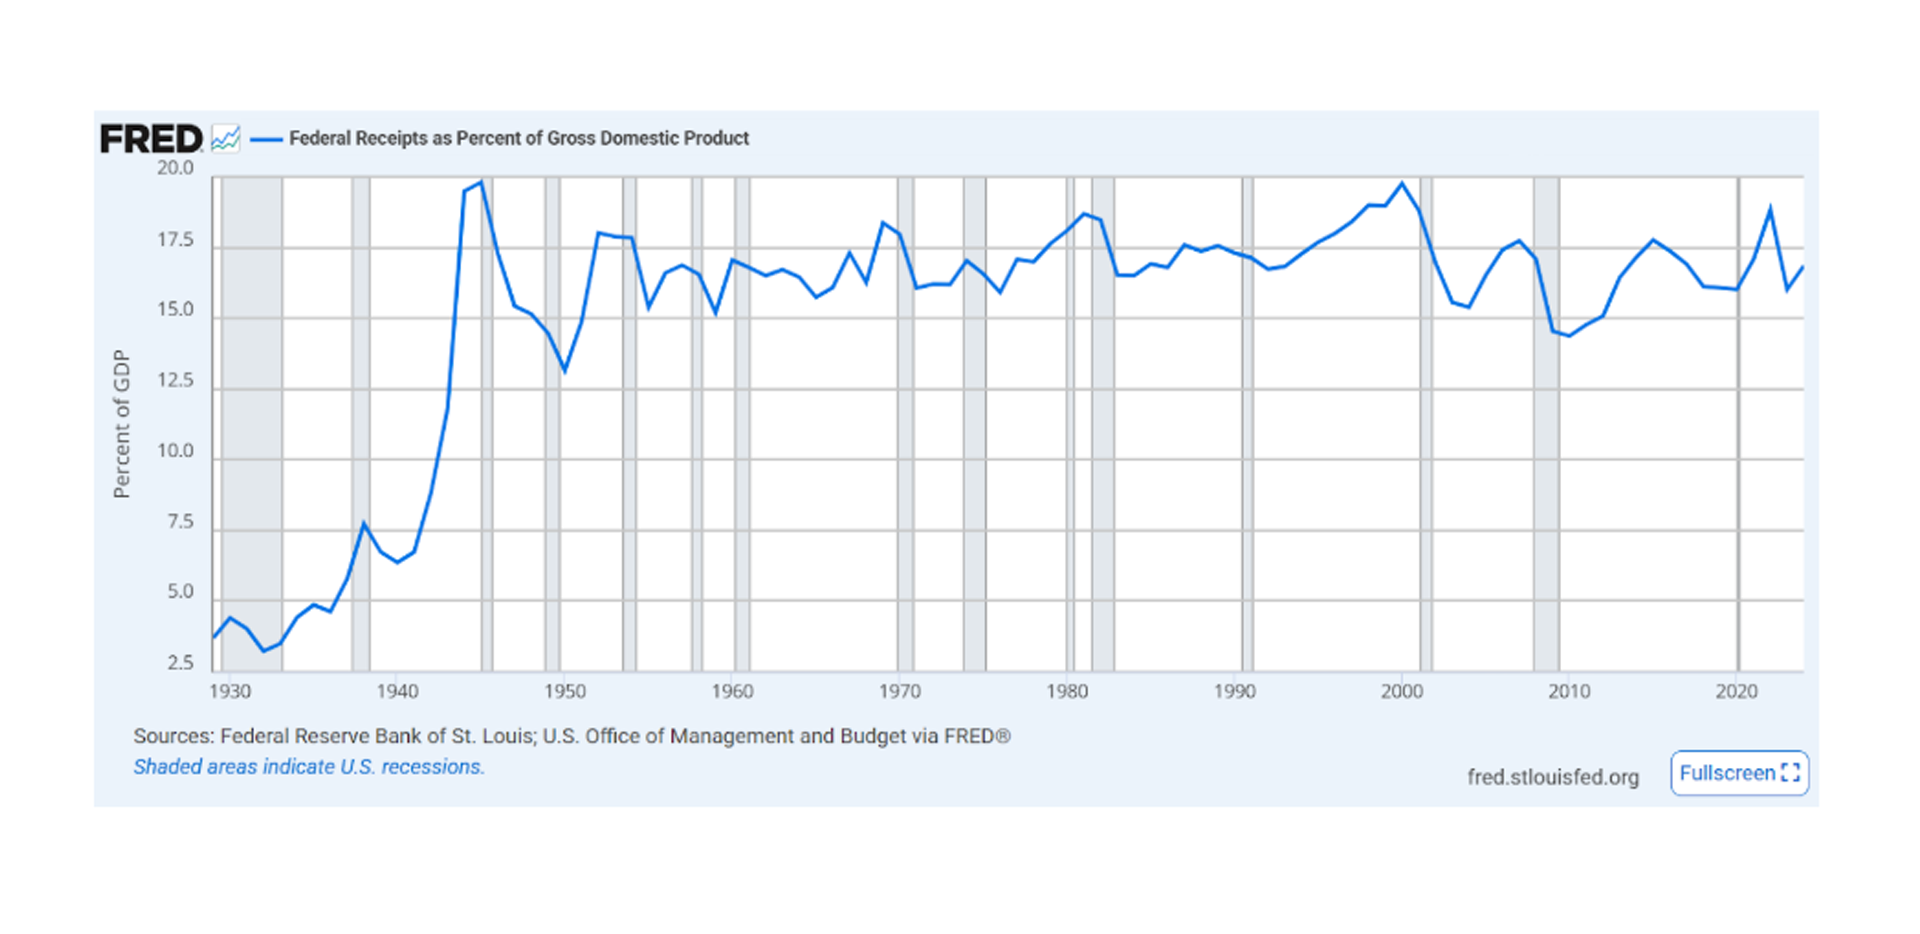
Another part of the Trump administration’s agenda is to cut taxes for the better off while cutting spending on benefits for the poor, like health (Medicaid) and food (SNAP). The administration argues that these tax cuts pay for themselves because economic growth accelerates, pushing up tax revenues. But history does not bear this out. Tax revenues fell, as a percentage of GDP, after the Bush tax cuts of the early 2000s and the Trump cuts in 2017. The decline occurred before the pandemic of 2020.
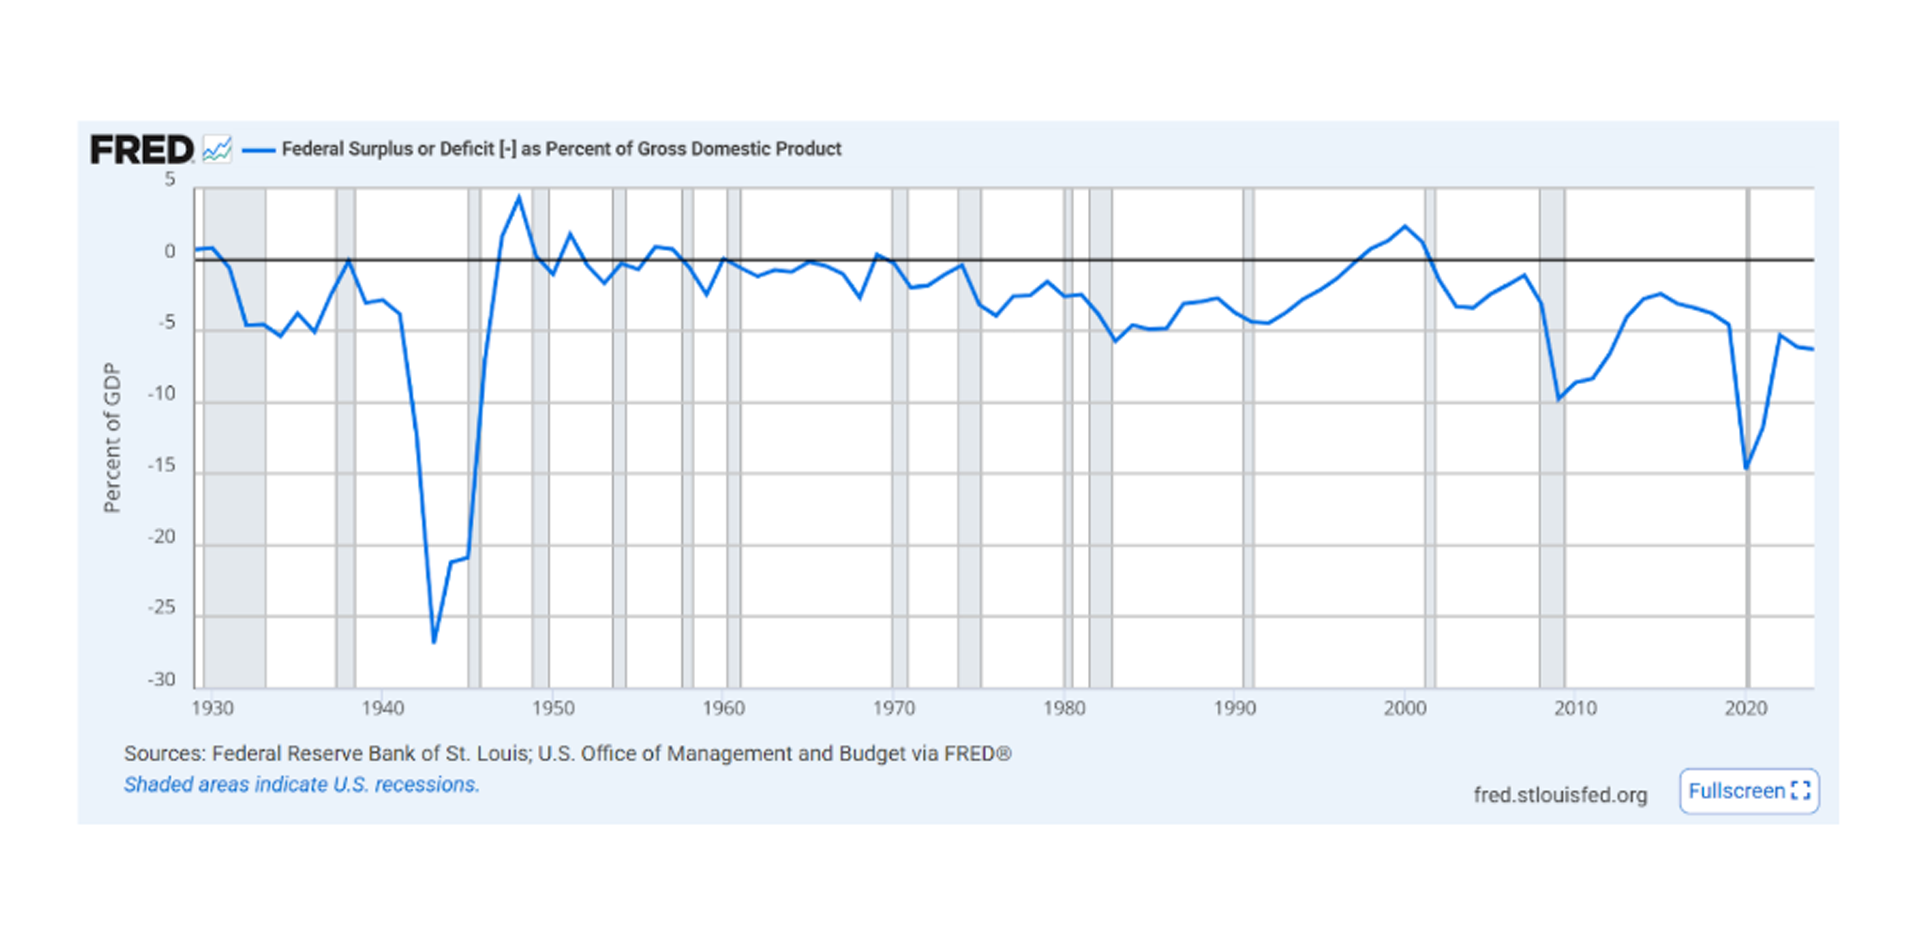
And the budget deficit grew on both occasions. Both graphs from the Federal Reserve Bank of St Louis.
Find out more about what the trade war means for the world in The Economic Consequences of Mr Trump.